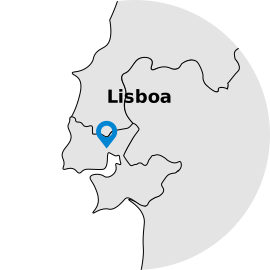


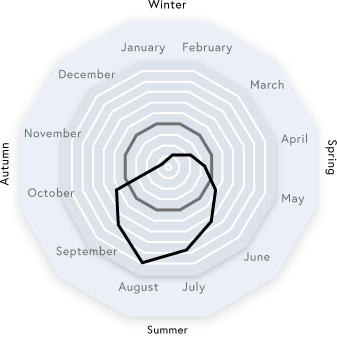
Greater Lisbon

 Tourism developments
481
 Accommodation capacity (No. of rooms)
42891
RevPAR (millions of €)
105.8
Room occupancy rate (%)
73.5
Room income (millions of €)
1 652.2
Revenue from accommodation (millions of euros)
2 055.2
Overnight stays (thousand)
19 633.1
Guests (thousand)
8 722.8
Average stay (No. of nights)
2.3
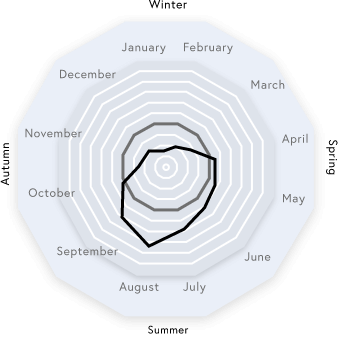
North
 Tourism developments
2 022
Accommodation capacity (No. of rooms)4 4412
RevPAR (millions of €)
58.2
Room occupancy rate (%)
62.7
Room income (millions of €)
898.4
Revenue from accommodation (millions of euros)
1 154.5
Overnight stays (thousand)
14 738.7
Guests (thousand)
7 682.2
Average stay (No. of nights)
1.9
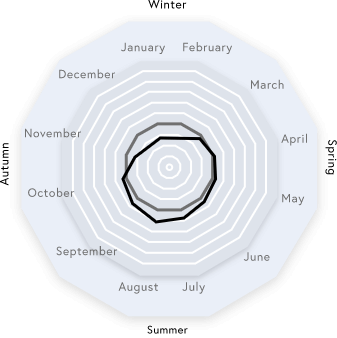
Centre
 Tourism developments
1 062
Accommodation capacity (No. of rooms)20 831
RevPAR (millions of €)
35.3
Occupancy rate (%)
49.9
Room income (millions of €)
258.1
Revenue from accommodation (millions of euros)
342.5
Overnight stays (thousand)
5 251.9
Guests (thousand)
3 041.6
Average stay (No. of nights)
1.7
Alentejo
 Tourism developments
838
Accommodation capacity (No. of rooms)13 286
RevPAR (millions of €)
52.2
Room occupancy rate (%)
59.1
Room income (millions of €)
231.8
Revenue from accommodation (millions of euros)
307.6
Overnight stays (thousand)
3 2461.4
Guests (thousand)
1 766.7
Average stay (No. of nights)
2.0
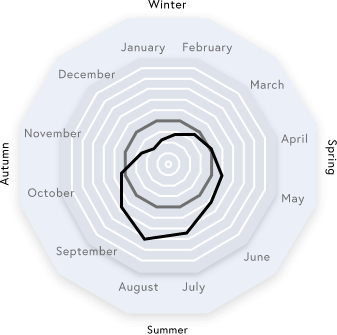
Algarve
 Tourism developments
689
Accommodation capacity (No. of rooms)53 780
RevPAR (millions of €)
78.5
Room occupancy rate (%)
65.3
Room income (millions of €)
1 349.8
Revenue from accommodation (millions of euros).
1 808.9
Overnight stays (thousand)
20 820.5
Guests (thousand)
5 344.7
Average stay (No. of nights)
3.9
Autonomous Region of Madeira
 Tourism developments
507
Accommodation capacity (No. of rooms)18 294
RevPAR (millions of €)
97.6
Room occupancy rate (%)
80.7
Room income (millions of €)
643
Revenue from accommodation (millions of euros)
894.2
Overnight stays (thousand)
9 934.5
Guests (thousand)
2 167.9
Average stay (No. of nights)
4.6
Autonomous Region of the Azores
 Tourism developments
358
Accommodation capacity (No. of rooms)9 173
RevPAR (millions of €)
65.9
Room occupancy rate (%)
65.7
Room income (millions of €)
201.1
Revenue from accommodation (millions of euros)
255
Overnight stays (thousand)
3 101.6
Guests (thousand)
1 030.2
Guests (thousand)
3.0
West and Tagus Valley
 Tourism developments
398
Accommodation capacity (No. of rooms)13 254
RevPAR (millions of €)
35.8
Room occupancy rate (%)
51
Room income (millions of €)
164.4
Revenue from accommodation (millions of euros)
227
Overnight stays (thousand)
3 509.1
Guests (thousand)
1 959.9
Average stay (No. of nights)
1.8
Setubal Peninsula
 Tourism developments
77
Accommodation capacity (No. of rooms)4299
RevPAR (millions of €)
56.1
Room occupancy rate (%)
63.2
Room income (millions of €)
85.1
Revenue from accommodation (millions of euros)
110
Overnight stays (thousand)
1 637.2
Guests (thousand)
808
Average stay (No. of nights)
2
Source: TravelBI
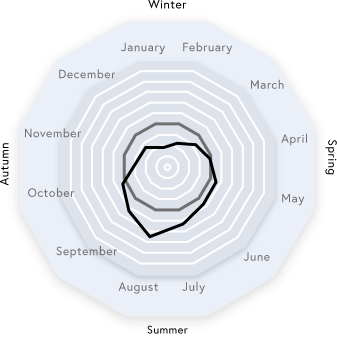
North
Centre
M. A. Lisbon

Alentejo
Algarve
A. R. Azores

A. R. Madeira